
No, we are NOT in a Housing Bubble

Home values appreciated by almost ten percent nationwide in 2020, and they’re forecast to continue rising this year. This has some voicing concern that we may be in another housing bubble like the one we experienced a little over a decade ago.
However, there are many reasons this real estate market is nothing like 2008.
This time, housing supply is extremely limited
The price of any item is determined by supply and demand. If supply is high and demand is low, prices normally decrease. If supply is low and demand is high, prices naturally increase. In real estate, this balance is measured in “months’ supply of inventory” which is based on the number of current homes for sale compared to the number of buyers in the market. The normal months’ supply of inventory for the market is about 6 months. Anything above that defines a buyers’ market, indicating prices will soften. Anything below that defines a sellers’ market in which prices normally appreciate. Between 2006 and 2008, the months’ supply of inventory increased from just over 5 months to 11 months. The months’ supply was over 7 months in twenty-seven of those thirty-six months, yet home values continued to rise. Months’ inventory has been under 5 months for the last 3 years, under 4 for thirteen of the last fourteen months, and under 3 for the last six months. It currently stands at 1.9 months – a historic low. Remember, if supply is low and demand is high, prices naturally increase.
This time, housing demand is real
During the housing boom in the mid-2000s, there was what Robert Schiller, a fellow at the Yale School of Management's International Center for Finance, called “irrational exuberance.” The definition of the term is, “unfounded market optimism that lacks a real foundation of fundamental valuation, but instead rests on psychological factors.” Without considering historic market trends, people got caught up in the frenzy and bought houses based on an unrealistic belief that housing values would continue to escalate. The mortgage industry fed into this craziness by making mortgage money available to just about anyone, as shown in the Mortgage Credit Availability Index (MCAI) published by the Mortgage Bankers Association. The higher the index, the easier it is to get a mortgage; the lower the index, the more difficult it is to obtain one. Prior to the housing boom, the index stood just below 400. In 2006, the index hit an all-time high of over 868, meaning just about anyone could qualify for a mortgage. Today, the index stands at 124.6, which is well below even the pre-boom level.In the current real estate market, demand is real, not fabricated. Millennials, the largest generation in the country, have come of age to marry and have children, which are two major drivers for homeownership. The health crisis is also challenging every household to redefine the meaning of “home” and re-evaluate whether their current home meets that new definition. This desire to own, coupled with historically low mortgage rates, makes purchasing a home today a strong, sound financial decision. Therefore, today’s demand is very real. Remember, if supply is low and demand is high, prices naturally increase.
This time, households have plenty of equity
Again, during the housing boom, it wasn’t just purchasers who got caught up in the frenzy. Existing homeowners started using their homes like ATM machines. There was a wave of cashout refinances, which enabled homeowners to leverage the equity in their homes. From 2005 through 2007, Americans pulled out $824 billion dollars in equity. That left many homeowners with little or no equity in their homes at a critical time. As prices began to drop, some homeowners found themselves in a negative equity situation where the mortgage was higher than the value of their home. Many defaulted on their payments, which led to an avalanche of foreclosures. Today, the banks and the American people have shown they learned a valuable lesson from the housing crisis a little over a decade ago. Cash-out refinance volume over the last three years was less than a third of what it was compared to the 3 years leading up to the crash. This approach has created levels of equity never seen before. According to Census Bureau data, over 38% of owner-occupied housing units are owned ‘free and clear’ (without any mortgage). Also, ATTOM Data Solutions just released their fourth quarter 2020 U.S. Home Equity Report, which reveals: “17.8 million residential properties in the United States were considered equity-rich, meaning that the combined estimated amount of loans secured by those properties was 50 percent or less of their estimated market value…The count of equity-rich properties in the fourth quarter of 2020 represented 30.2 percent, or about one in three, of the 59 million mortgaged homes in the United States.” If we combine the 38% of homes that are owned free and clear with the 18.7% of all homes that have at least 50% equity (30.2% of the remaining 62% with a mortgage), we realize that 56.7% of all homes in this country have a minimum of 50% equity. That’s significantly better than the equity situation in 2008.
Mortgage standards are nothing like they were back then
During the housing bubble, it was difficult not to get a mortgage. Today, it’s tough to qualify. Recently, the Urban Institute released their latest Housing Credit Availability Index (HCAI) which “measures the percentage of owner-occupied home purchase loans that are likely to default—that is, go unpaid for more than 90 days past their due date. A lower HCAI indicates that lenders are unwilling to tolerate defaults and are imposing tighter lending standards, making it harder to get a loan. A higher HCAI indicates that lenders are willing to tolerate defaults and are taking more risks, making it easier to get a loan.”
The index shows that lenders were comfortable taking on high levels of risk during the housing boom of 2004-2006. It also reveals that today, the HCAI is under 5 percent, which is the lowest it’s been since the introduction of the index. The report explains:
“Significant space remains to safely expand the credit box. If the current default risk was doubled across all channels, risk would still be well within the pre-crisis standard of 12.5 percent from 2001 to 2003 for the whole mortgage market.”
This is nothing like the last time.
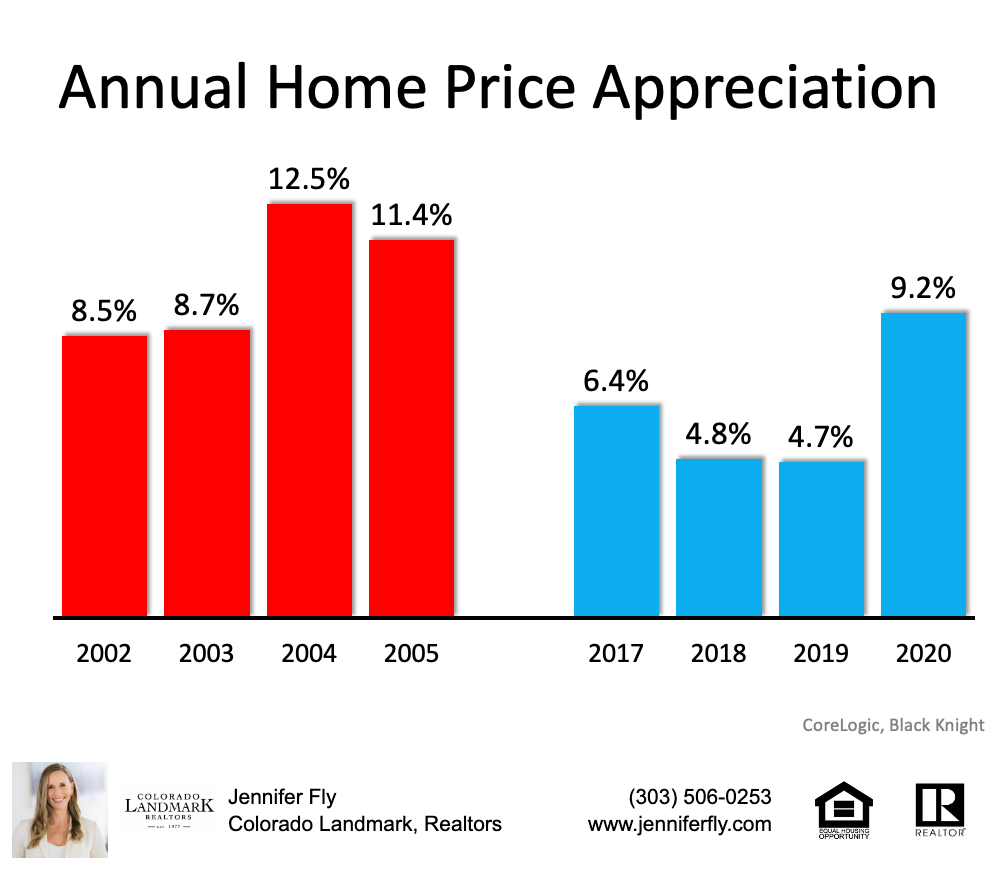
Prices aren’t soaring out of control
Below is a graph showing annual home price appreciation over the past four years compared to the four years leading up to the height of the housing bubble. Though price appreciation was quite strong last year, it’s nowhere near the rise in prices that preceded the crash.There’s a stark difference between these two periods of time. Normal appreciation is 3.8%. So, while current appreciation is higher than the historic norm, it’s certainly not accelerating out of control as it did in the early 2000s.
Houses aren’t becoming too expensive to buy
The affordability formula has three components: the price of the home, the wages earned by the purchaser, and the mortgage rate available at the time. Fifteen years ago, prices were high, wages were low, and mortgage rates were over 6%. Today, prices are still high. Wages, however, have increased, and the mortgage rate is about 3%. That means the average homeowner pays less of their monthly income toward their mortgage payment than they did back then.
As Mark Fleming, Chief Economist for First American, explains:
“Lower mortgage interest rates and rising incomes correspond with higher house prices as home buyers can afford to borrow and buy more. If housing is appropriately valued, house-buying power should equal or outpace the median sale price of a home. Looking back at the bubble years, house prices exceeded house-buying power in 2006, but today house-buying power is nearly twice as high as the median sale price nationally.”
Bottom line: this real estate market is completely different from the market in 2008 that lead to the housing crash.